100 MHz
PCBITE-6013
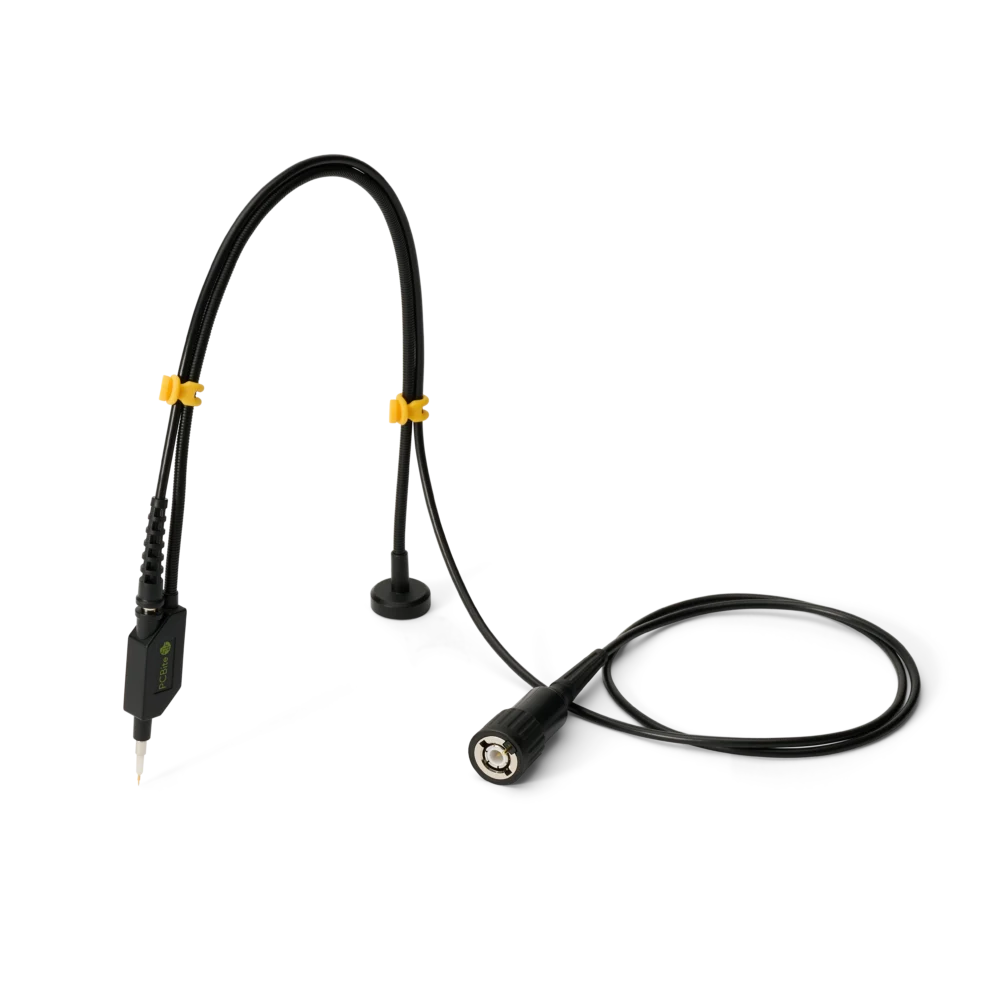
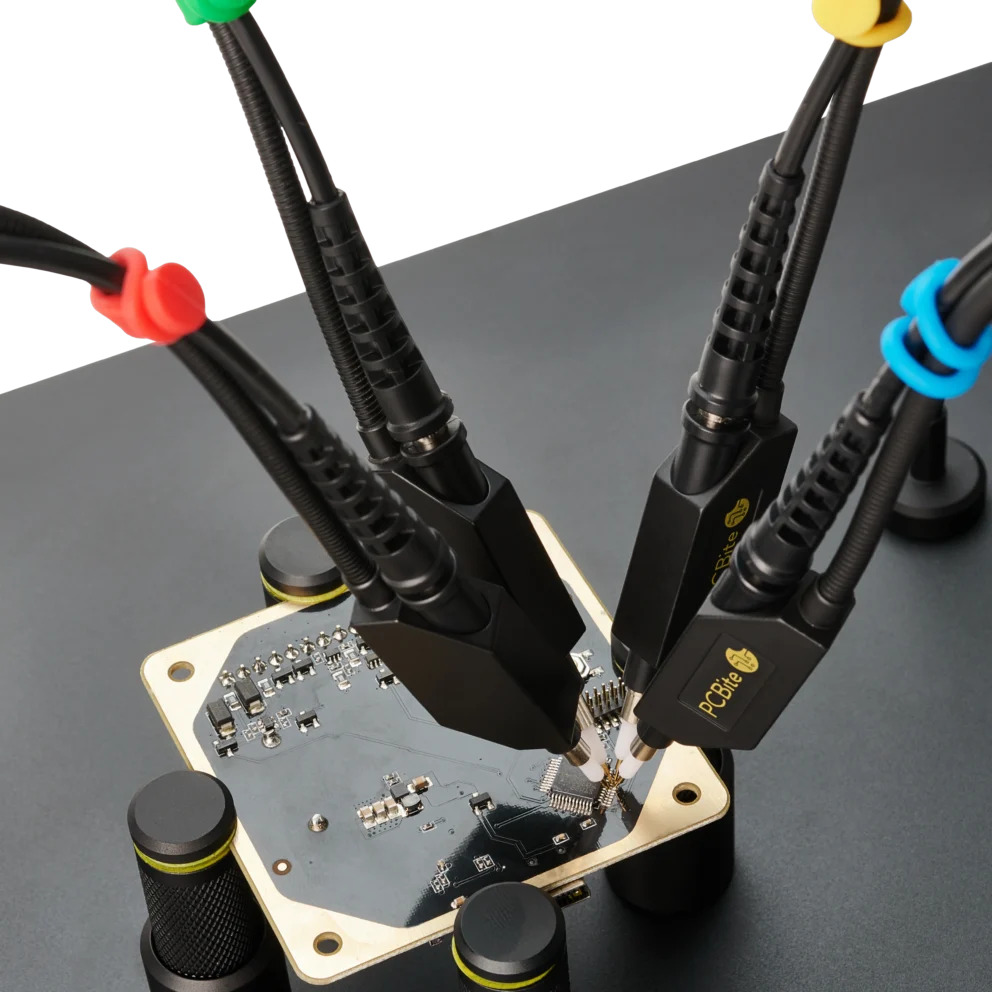
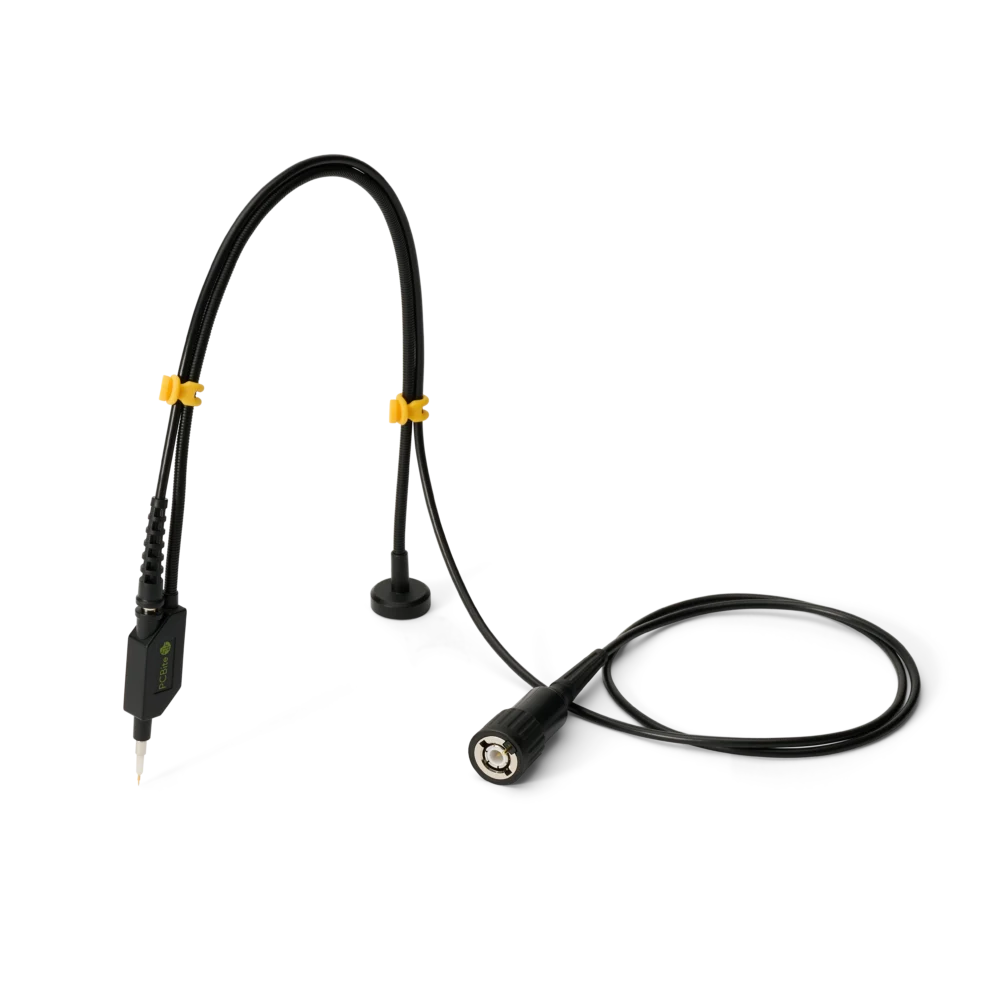
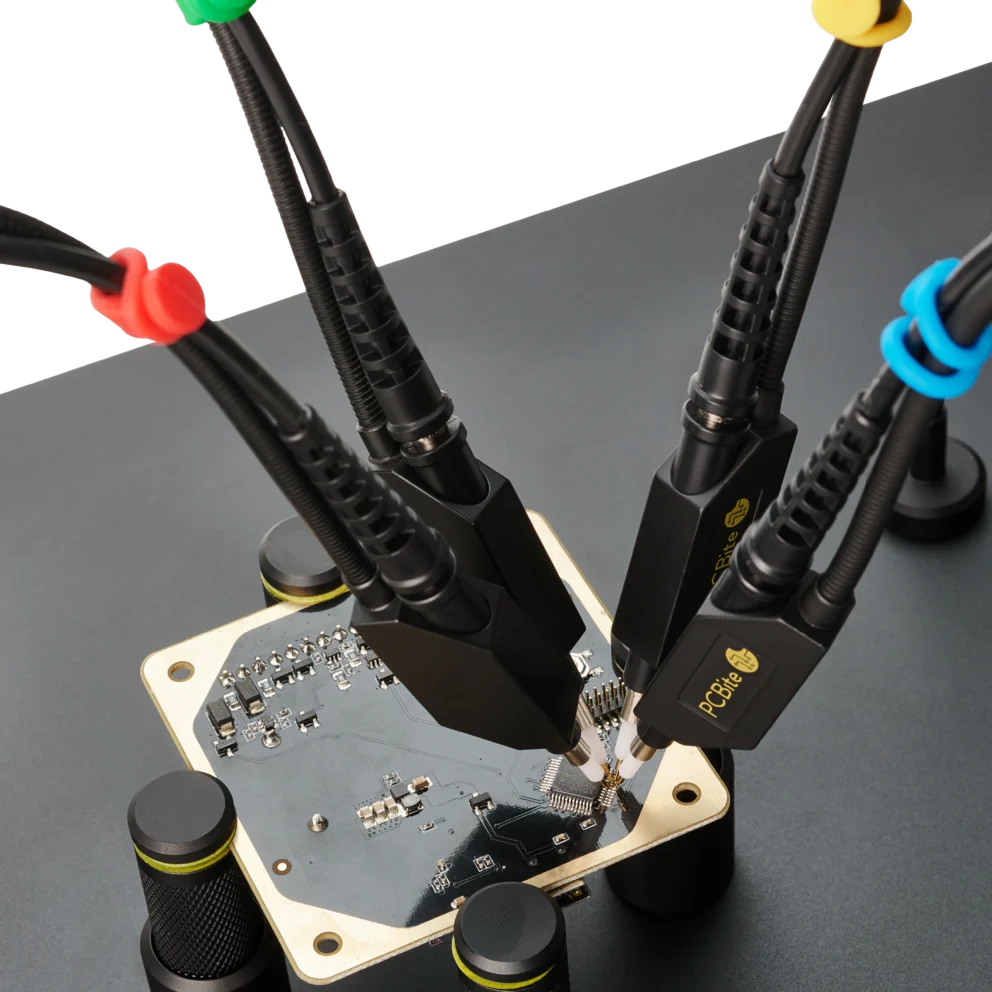
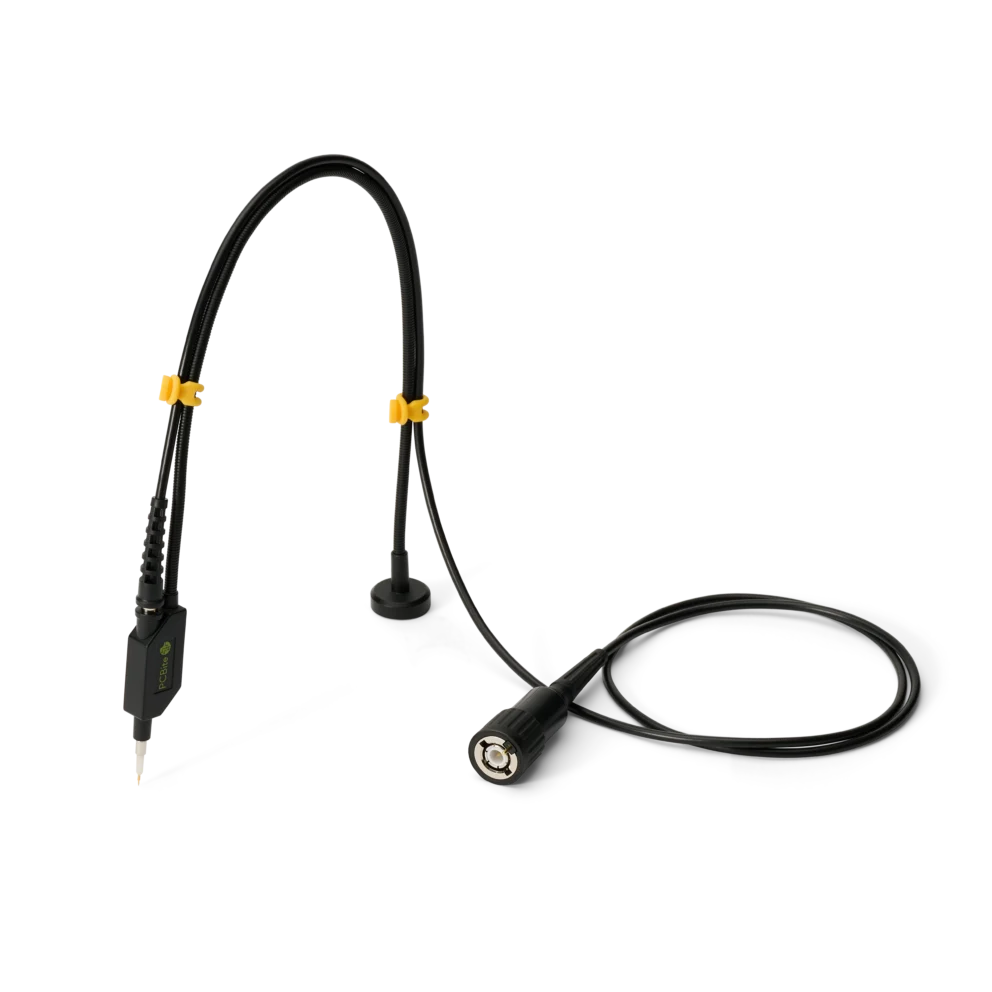
SQ100 – 100 MHz handsfree oscilloscope probe
59 €
In stock
A probe rated 10 MΩ and 300 V meets both figures only at low frequencies. As the frequency rises, its input impedance falls, and so does the voltage it may measure. This article explains why, and how to read the two curves.
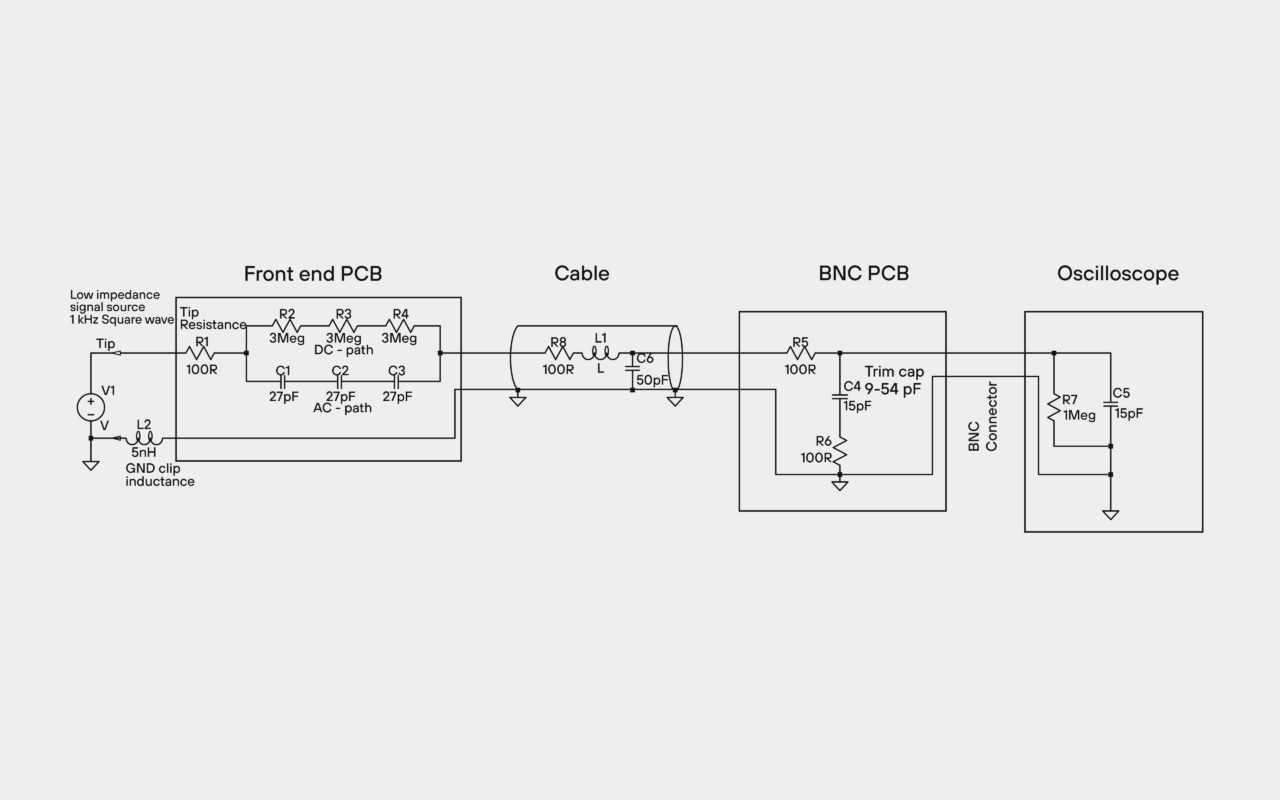
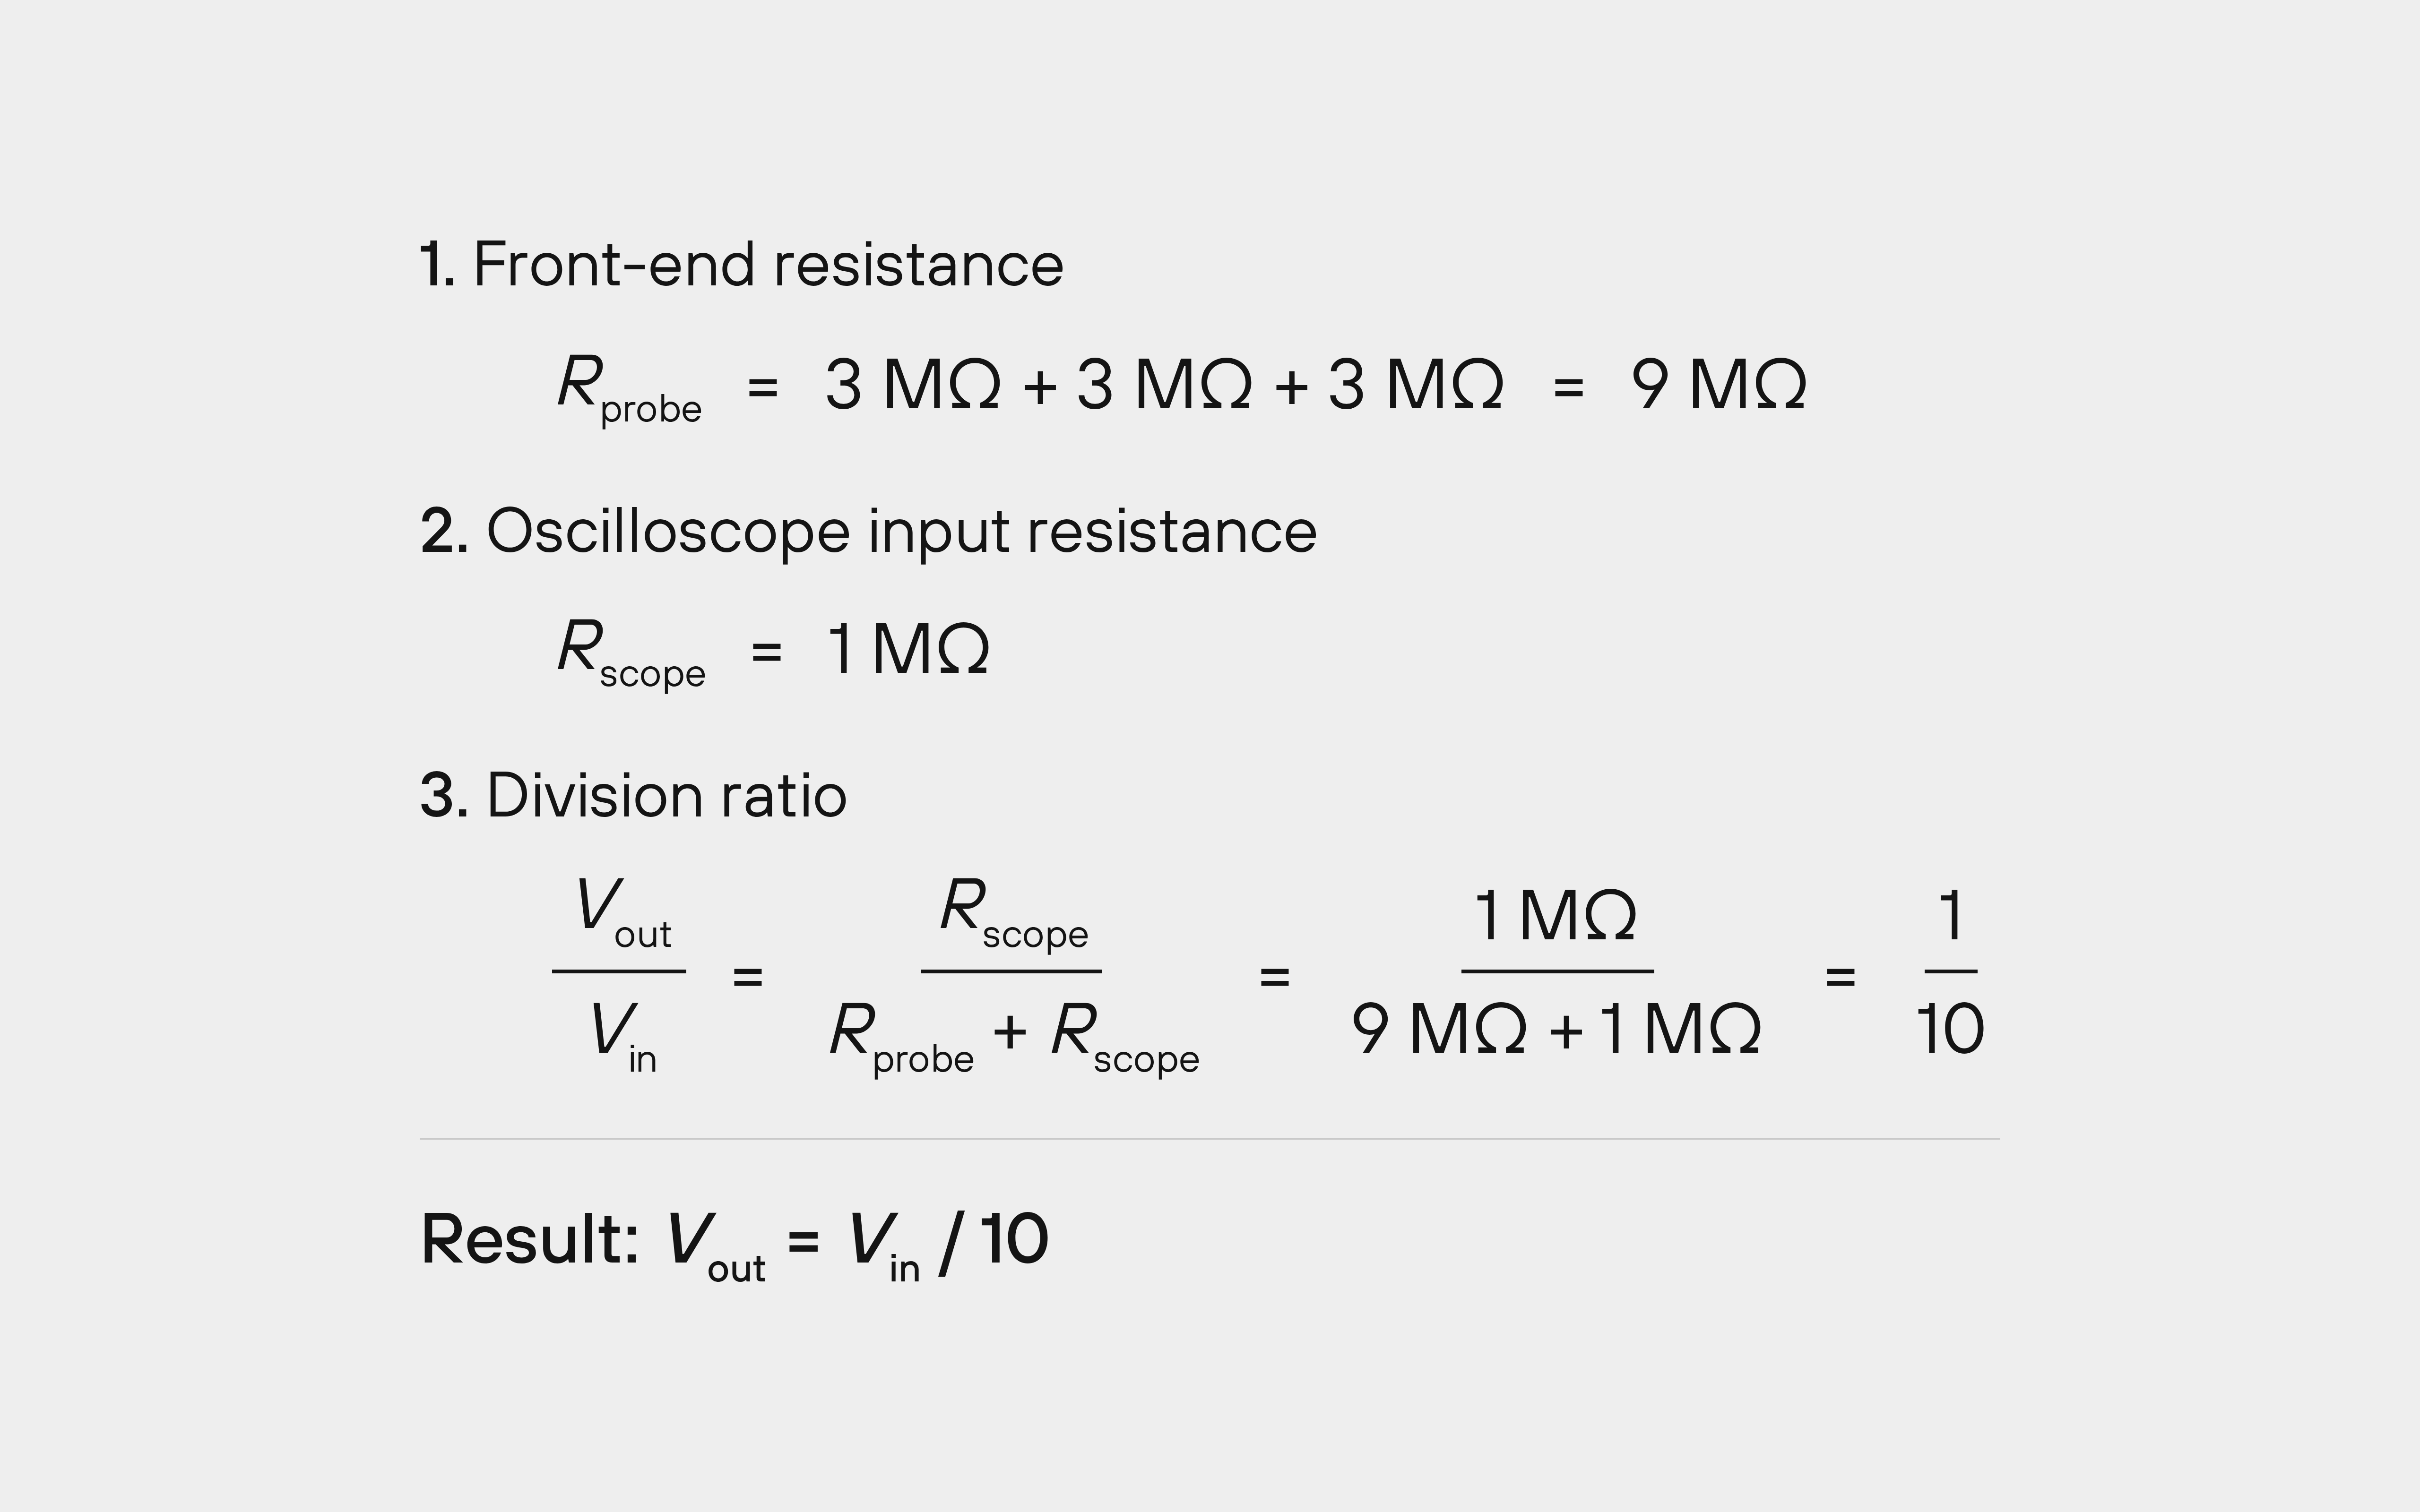
A 10:1 probe rated 10 MΩ typically has 9 MΩ in the probe, in series with the oscilloscope’s 1 MΩ input. Together they divide the signal by ten: a 10 V signal arrives as 1 V at the oscilloscope.
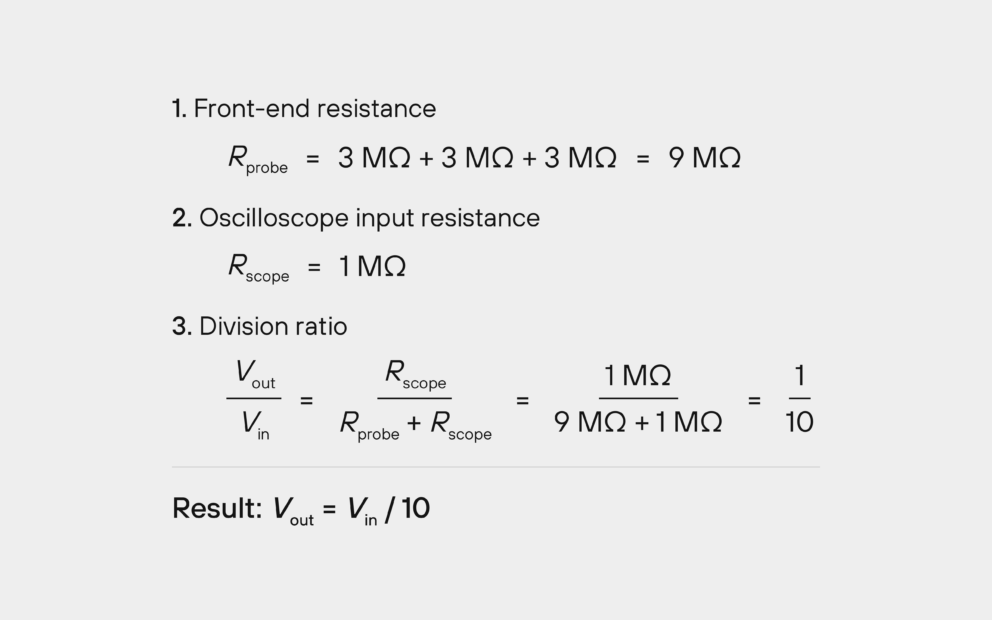
Fig. 1. At DC, the 9 MΩ in the probe and the 1 MΩ oscilloscope input divide the signal by ten.
The probe tip also has a capacitance, in parallel with the resistance, so the impedance falls as the frequency rises. The impedance curve in the datasheet shows how much.
In a simple probe, the tip capacitance alone sets the curve. A capacitance of 9 pF is about 1.8 kΩ at 10 MHz and about 180 Ω at 100 MHz, so such a probe loads a fast circuit heavily, and the signal you measure can change.
Better probes, such as the PCBite SQ100 to SQ500, use other techniques to keep the impedance up at higher frequencies. Their real values are in the impedance curve in each datasheet.
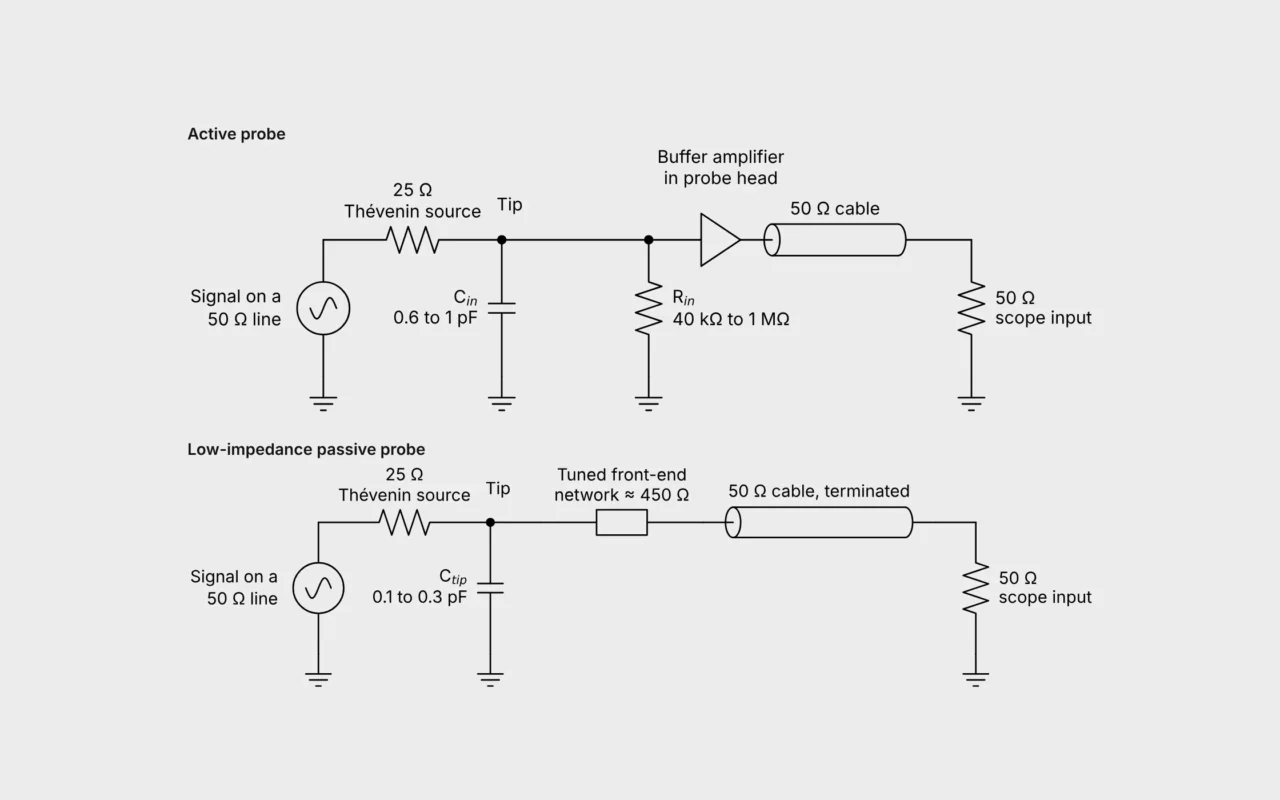
For RF and high-speed lines, a low impedance probe such as the SQG series gives a defined load of 500 or 333 Ω, with a typical tip capacitance of only 0.35 pF.
The second curve shows the maximum input voltage over frequency. A probe rated CAT II 300 V RMS can take that voltage at low frequencies, but the rating falls as the frequency rises. Two things set the limit:
For probes rated above 100 kHz whose shield may float, clause 7.3.4.3 derives the maximum voltage from the capacitance between the shield and the surfaces you hold. It is measured with metal foil wrapped around the probe body, the connector and 150 mm of cable.
As the frequency rises, the permitted voltage falls towards 35 V RMS: 70 mA through the 500 Ω of the standard’s measuring network. With the cable capacitance of the PCBite oscilloscope probes, it is close to 35 V from about 5 MHz.
The derating curve in the datasheet combines both limits.
The curves for PCBite probes are in each probe’s datasheet, under Downloads on the product page. How the probe divides the signal at DC and at high frequencies is explained in How passive oscilloscope probes really work.
Du använder en föråldrad webbläsare. Alla funktioner fungerar inte i din webbläsare. Var vänlig uppgradera din webbläsare för att förbättra din upplevelse och öka din säkerhet.